
Linux-Unix system administrators occasionally need some tools to track systems. You may need to know the system well and intervene immediately in case of a problem.This might be performance problems or debug problems etc.These tools will help you in these situations.You should know this tools.
1.Lsof-Show Open Files
You can use lsof to identify open files and network connections on Linux and Unix systems.The basis of Linux / UNIX systems is the “file” definition, in other words everything on a Linux / UNIX system is a file.Systems are done through files that are made on the processes. In a system analysis, the type of files, the status, the information about who uses it is important.If you want to use lsof in Linux,you should install lsof package via yum.
root@emre:/home/root # lsof /gunluk #Unix
COMMAND PID USER FD TYPE DEVICE SIZE/OFF NODE NAME
ksh 35848424 root cwd VDIR 27,1 4096 2 /gunluk (/dev/gnlkbklv)
backbynam 47906918 root cwd VDIR 27,1 4096 2 /gunluk (/dev/gnlkbklv)
backbynam 47906918 root 1w VREG 27,1 61760 40 /gunluk (/dev/gnlkbklv)
backbynam 47906918 root 6r VREG 27,1 126248358052 237715 /gunluk (/dev/gnlkbklv)
find 51118120 root cwd VDIR 27,1 12288 4134 /gunluk (/dev/gnlkbklv)
find 51118120 root 4r VDIR 27,1 4096 2 /gunluk (/dev/gnlkbklv)
find 51118120 root 5r VDIR 27,1 4096 2 /gunluk (/dev/gnlkbklv)
find 51118120 root 6r VDIR 27,1 256 4131 /gunluk (/dev/gnlkbklv)
find 51118120 root 7r VDIR 27,1 12288 4134 /gunluk (/dev/gnlkbklv)
[root@emre ~]# lsof /run/systemd/notify  #Linux
COMMAND PID USER   FD   TYPE             DEVICE SIZE/OFF NODE NAME
systemd   1 root   22u  unix 0xffff880127b0c800      0t0 6736 /run/systemd/notify
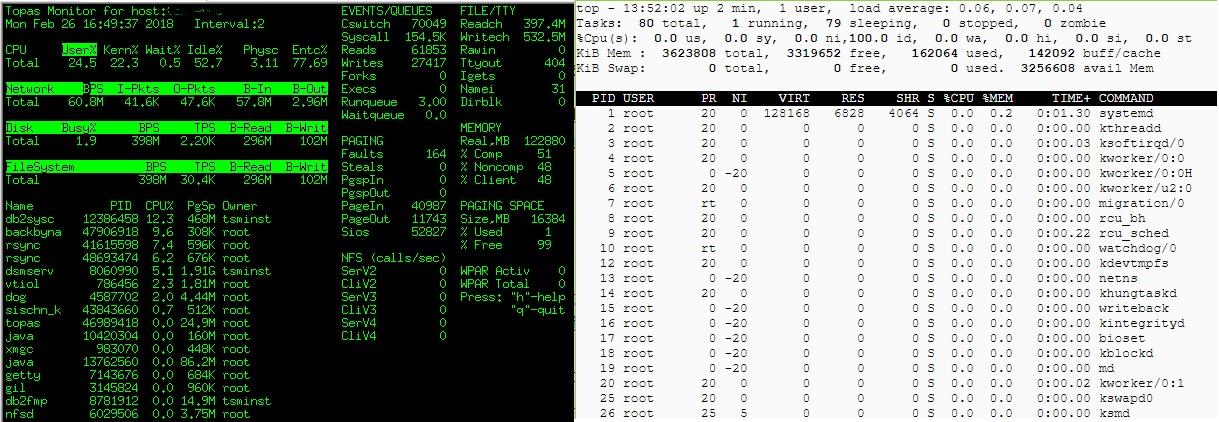
2.Top(Linux)-Topas(AIX)- Process Monitoring
Linux Top command or Unix Topas command is often used by most system administrators to monitor Linux and Unix performance. And it is a performance monitoring program that is found under most Linux / Unix-like operating systems.The top program provides a dynamic real-time view of a running system.It can display system summary information, as well as a list of processes or threads currently being managed by the kernel, CPU usage, Memory usage, Swap Memory, Cache Size, Buffer Size, Process PID, User, Commands and much more. It also shows high memory and cpu utilization of a running processess.
[root@emre ~]# top #Linux
root@emre:/home/root # topas #Unix
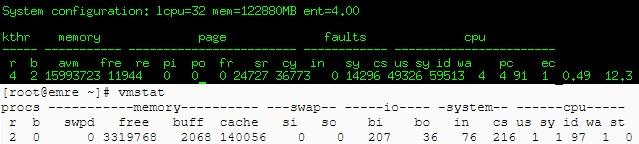
3.VmStat – Virtual Memory Statistics
The vmstat command reports statistics about hypervisor pages,virtual memory, disks,kernel threads, , traps, and processor activity.If you want to use vmstat in Linux,you should install sysstat package via yum.
[root@emre ~]# vmstat #Linux and Unix
4.Tcpdump-Network Package Analyzer
Tcpdump is a package analyzer program that runs on the command line on computers with Linux – Unix operating system. It provides the ability to capture and observe TCP / IP packets or other packets transmitted or received over a network that the user is connected to.If you want to use tcpdump in Linux,you should install tcpdump package via yum.
root@tsmserver:/home/root # tcpdump -i en4|more  #Unix
tcpdump: verbose output suppressed, use -v or -vv for full protocol decode
listening on en4, link-type 1, capture size 96 bytes
17:08:36.911520 IP stby105.13219 > tsmserver.vlsi-lm: . 104632948:104634396(1448) ack 592559840 win 65160 <nop,nop,timestamp 1530012193 1525541171>
17:08:36.911522 IP stby105.13219 > tsmserver.vlsi-lm: . 1448:2896(1448) ack 1 win 65160 <nop,nop,timestamp 1530012193 1525541171>
17:08:36.911523 IP stby105.13219 > tsmserver.vlsi-lm: . 2896:4344(1448) ack 1 win 65160 <nop,nop,timestamp 1530012193 1525541171>
17:08:36.911523 IP stby105.13219 > tsmserver.vlsi-lm: . 4344:5792(1448) ack 1 win 65160 <nop,nop,timestamp 1530012193 1525541171>
[root@emre ~]# tcpdump |more  #Linux
tcpdump: verbose output suppressed, use -v or -vv for full protocol decode
listening on eth0, link-type EN10MB (Ethernet), capture size 262144 bytes
14:12:30.297162 IP emre.c.kubernetes-191507.internal.ssh > 173.194.92.34.49018: Flags [P.], seq 1508282308:150828
2516, ack 4170064696, win 405, options [nop,nop,TS val 1073508 ecr 2291522340], length 208
14:12:30.297504 IP emre.c.kubernetes-191507.internal.50364 > metadata.google.internal.domain: 36426+ PTR? 34.92.1
94.173.in-addr.arpa. (44)
5.Netstat – Network Statistics
It is a console command that can give you detailed information about network connections, routing tables, interface statistics, and similar network connection information.It also allows us to see the scrolling tables along with the incoming and outgoing links.It helps you control the open ports in your system, along with statistics for network cards.
[root@emre ~]# netstat -a |more #Linux
Active Internet connections (servers and established)
Proto Recv-Q Send-Q Local Address           Foreign Address         State
tcp        0      0 0.0.0.0:ssh             0.0.0.0:*               LISTEN
tcp        0      0 localhost:smtp          0.0.0.0:*               LISTEN
tcp        0      0 emre.c.kubernetes:50060 metadata.google.in:http CLOSE_WAIT
tcp        0     64 emre.c.kubernetes-1:ssh 173.194.92.34:49018     ESTABLISHED
tcp        0      0 emre.c.kubernetes:50064 metadata.google.in:http ESTABLISHED
tcp        0      0 emre.c.kubernetes:50066 metadata.google.in:http ESTABLISHED
tcp        0      0 emre.c.kubernetes:50068 metadata.google.in:http ESTABLISHED
tcp6       0      0 [::]:ssh                [::]:*                  LISTEN
tcp6       0      0 localhost:smtp          [::]:*                  LISTEN

root@emre:/home/root # netstat -ad |more #Unix
Active Internet connections (including servers)
Proto Recv-Q Send-Q Local Address Foreign Address (state)
tcp 0 0 *.* *.* CLOSED
tcp4 0 0 *.* *.* CLOSED
tcp 0 0 *.ftp *.* LISTEN
tcp6 0 0 *.ssh *.* LISTEN
tcp4 0 0 *.ssh *.* LISTEN
tcp4 0 0 emre.64118 emre.vlsi-lm CLOSE_WAIT
tcp 0 0 *.sunrpc *.* LISTEN
tcp 0 0 *.smux *.* LISTEN
tcp 0 0 *.shell *.* LISTEN
tcp 0 0 *.rmc *.* LISTEN
tcp4 0 0 emre.vlsi-lm emre.64874 ESTABLISHED
tcp 0 0 emre.64874 emre.vlsi-lm ESTABLISHED
tcp4 0 0 emre.vlsi-lm emre.64888 ESTABLISHED
tcp 0 0 emre.64888 emre.vlsi-lm ESTABLISHED
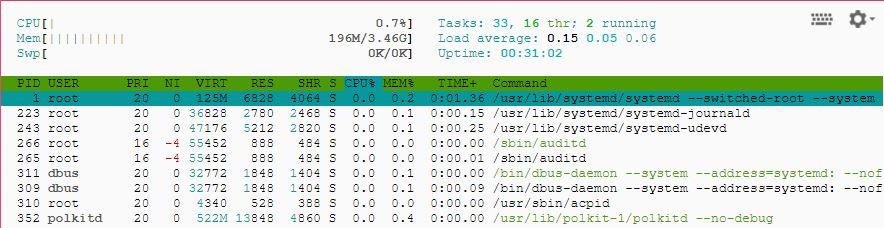
6.Htop – Linux Process Monitoring
The top command has similar properties. But it is easier to use and more colorful.If you want to use htop in Linux,you should install htop package via yum. Unix system does not have tihs package.You can use only Linux.
[root@emre ~]# htop
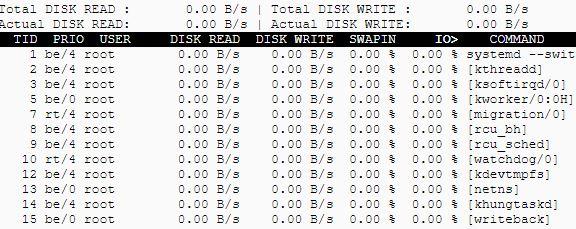
7.Iotop – Monitor Linux Disk I/O
Iotop is an open source and free utility similar to top command, that provides an easy way to monitor Linux Disk I/O usage details and prints a table of existing I/O utilization by process or threads on the systems.
[root@emre ~]# iotop
8. Iostat – Input/Output Statistics
The iostat command is a command line tool that displays the input and output storage system and display devices, local disks, remote disks such as NFS.If you want to use iostat in Linux,you should install sysstat package via yum.You can use iostat command like this in Unix.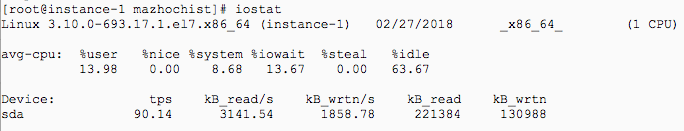
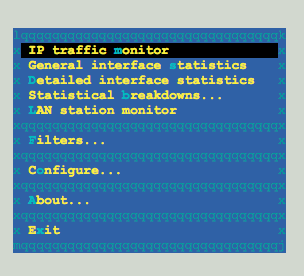
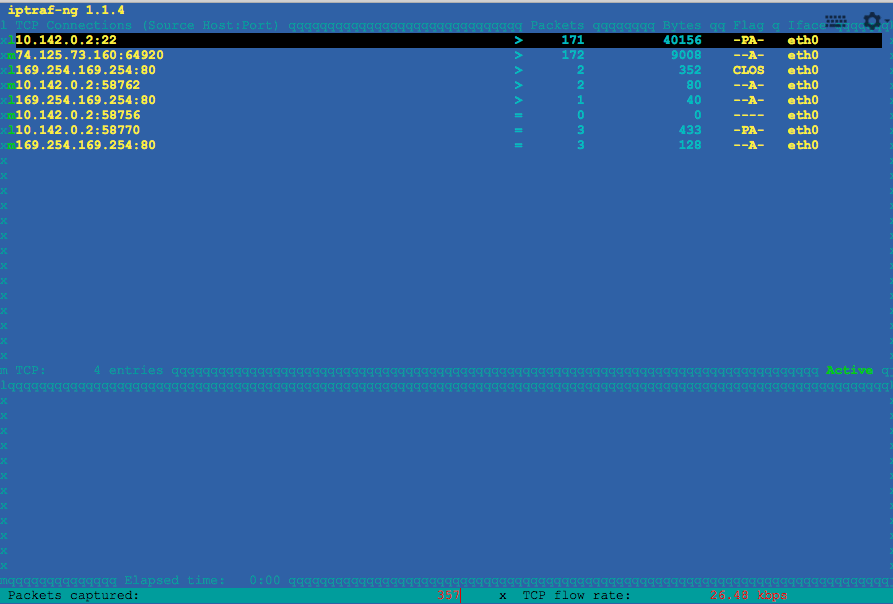
9.IPTraf – Real Time IP LAN Monitoring
IPTraf (Ip Network Monitoring Tool) is a tool that listen and monitor the traffic on interface.In shortly, we can call it a network monitor.You can see the packet status, which ports are connected to which port, and how much traffic is consumed. You can also see the connection in the right direction.If you want to use iptraf in Linux,you should install iptraf package via yum.
[root@instance-1 ~]# iptraf
10.Psacct or Acct- User process monitoring
psacct or acct are both open source tools that are used for monitoring user activity on a system.These tools run in backgrounds.If you want to use psacct in Linux,you should install psacct package via yum.
root@instance-1 ~]# ac
        total        0.33
[root@instance-1 ~]# ac -d
Today   total        0.34
[root@instance-1 ~]# ac -p
        mazhochist                           0.34
        total        0.34
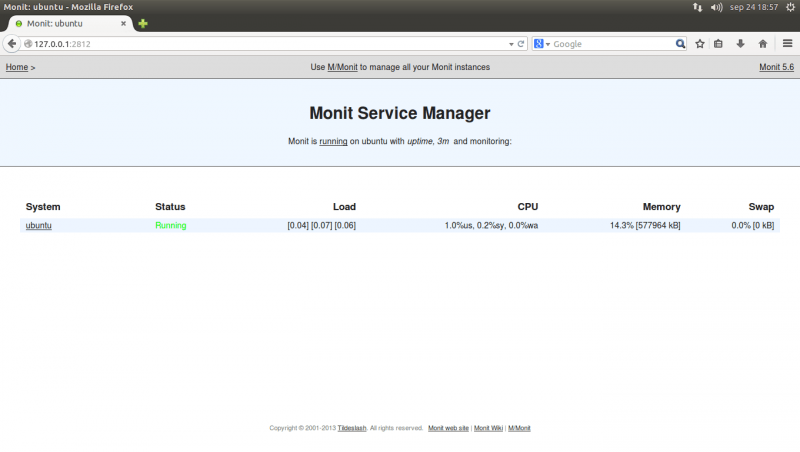
11. Monit – Linux Process and Services Monitoring
Monit,It is a tool that can be a good choice for monitoring relatively small networks, especially one or several servers.Apart from other tools, Monit,has the ability to restart the monitored services if they stop.If you want to use Monit in Linux,you should install Monit package via yum.
root@instance-1 ~]# monit
 New Monit id: f5c1203377cba45ecbc5bb9f9d643df7
 Stored in '/root/.monit.id'
Starting Monit 5.25.1 daemon with http interface at [localhost]:2812
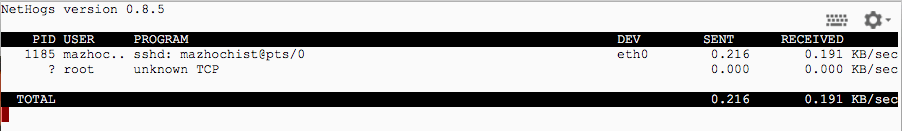
12.NetHogs – Monitor Per Process Network Bandwidth
With the Nethogs tool you can see the bandwidth and the most intensive operations used by individual transactions. In case of sudden bandwidth on the system, you can find the process account using the NetHOGs tool.If you want to use NetHogs in Linux,you should install Nethogs package via yum.
[root@instance-1 etc]# nethogs
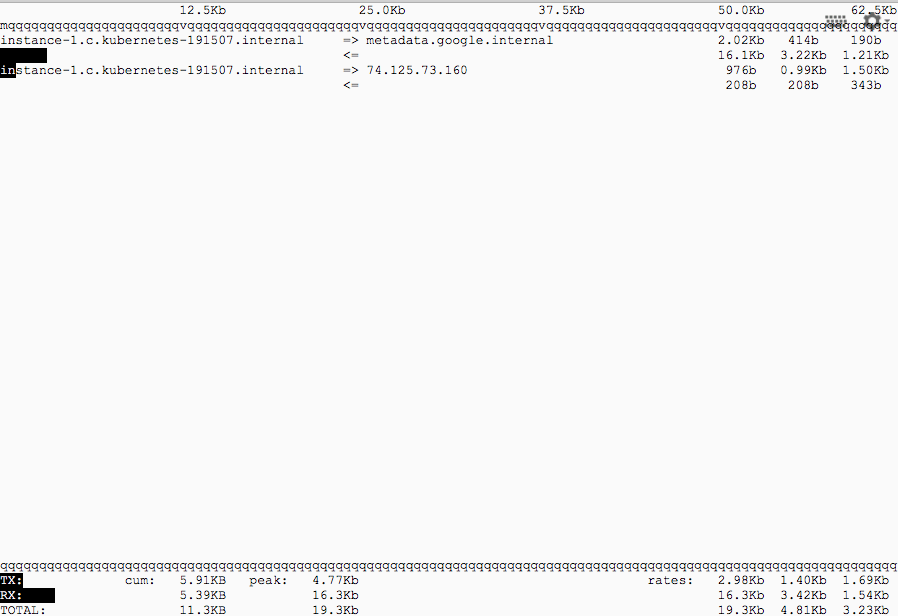
13. iftop – Network Bandwidth Monitoring
It is a nice application that can display network usage from command line like top.If you want to use if top in Linux,you should install if top package via yum.
[root@instance-1 etc]# iftop
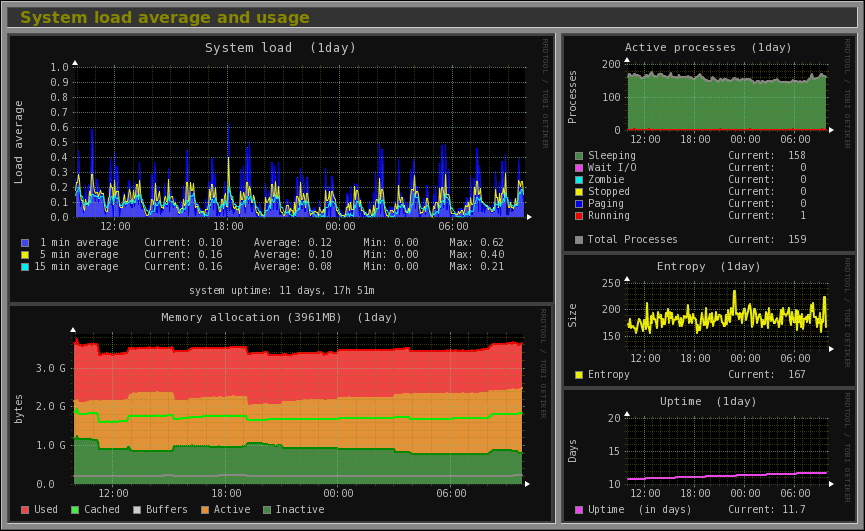
14. Monitorix – System and Network Monitoring
Monitorix is a free, open source, lightweight system monitoring tool.
15. Arpwatch – Ethernet Activity Monitor
Arpwatch Address Resolution Protocol (ARP), which is located in the local network, is an open source program used to monitor its activities.
arpwatch: bogon 10.142.0.1 42:01:0a:8e:00:01
From: root (Arpwatch)
To: root
Subject: new station (instance-1.c.kubernetes-191507.internal)
 hostname: instance-1.c.kubernetes-191507.internal
 ip address: 10.142.0.2
 ethernet address: 42:01:0a:8e:00:02
 ethernet vendor: <unknown>
 timestamp: Tuesday, February 27, 2018 18:10:25 +0000
16. Suricata – Network Security Monitoring
Suricata is an open source, intrusion detection and prevention system distributed with GPLv2 license. It is being developed and supported by the Open Information Security Foundation (OISF), a non-profit-making community.
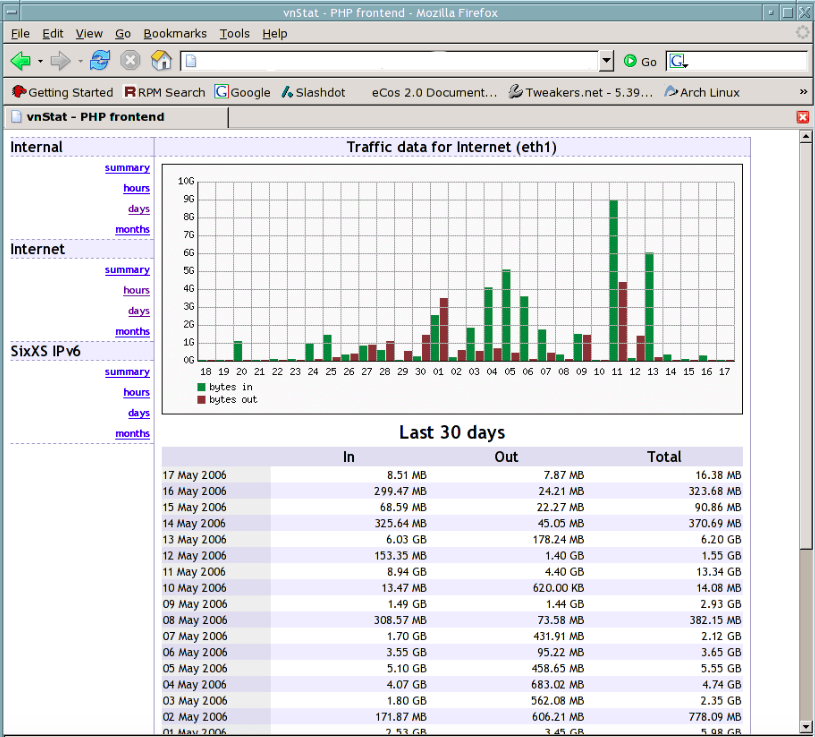
17. VnStat PHP – Monitoring Network Bandwidth
VnStat PHP frontend is a graphical web interface for network utility called VnStat.It uses the network interface statistics provided by the kernel as information source.
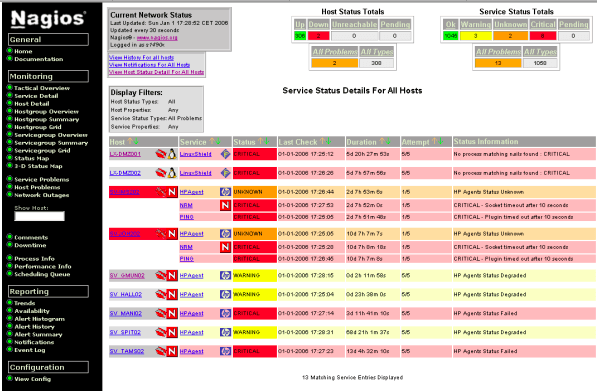
18. Nagios – Network/Server Monitoring
Nagios is a widely used GPL licensed and open source network monitoring system. Its flexible structure makes it very comfortable to use. You can almost monitor many devices and products that might come to mind.
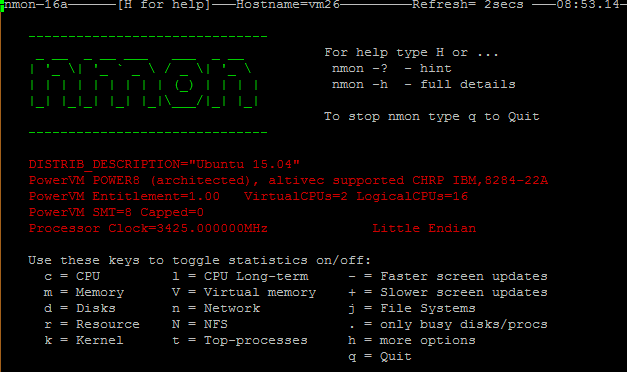
19. Nmon: Monitor Linux Performance
NMON is short for Nigel’s Performance Monitor and is available on AIX, Solaris ( with Sarmon) and Linux systems.
20. Collectl: All-in-One Performance Monitoring Tool
The collectl utility is a system monitoring tool that records or displays specific operating system data for one or more sets of subsystems.
[root@instance-1 etc]# collectl
waiting for 1 second sample...
#<--------CPU--------><----------Disks-----------><----------Network---------->
#cpu sys inter  ctxsw KBRead  Reads KBWrit Writes   KBIn  PktIn  KBOut  PktOut
   0   0    74     69      0      0      0      0      0      1      0       1
   0   0    85     83     72      2      0      0      0      1      0       1
   0   0    75     67      0      0      0      0      0      1      0       1
   0   0    76     67      0      0      0      0      0      1      0       1
   0   0    73     65      0      0      0      0      0      1      0       1
   0   0    81     69      0      0      0      0      0      1      0       1
   0   0    79     71      0      0      8      2      0      1      0       1
   0   0    77     70      0      0      0      0      0      1      0       1
   0   0    74     65      0      0      0      0      0      1      0       1
   0   0    71     63      0      0      0      0      0      1      0       1
If we’ve missed any important tool that you would like us to include in this list, please inform us via comments and please don’t forget to share it.


[…] wrote this tool briefly this post.The top command is the traditional way to view your system’s resource usage and see the […]